The Importance of Planning and Forecasting in Business Intelligence
The planning (i.e., budgeting and forecasting) process for most organizations is long and tedious and occurs on an annual basis, at least. The annual planning cycle is simply not responsive enough to change for most organizations. In recent times, companies have moved to rolling forecasts and driver-based planning to improve forecast accuracy.
Unlike many other business processes, planning is unique because it is forward looking. Business processes like accounting, inventory tracking, invoicing, shipping, etc. are backward looking, based on actual events from the past.
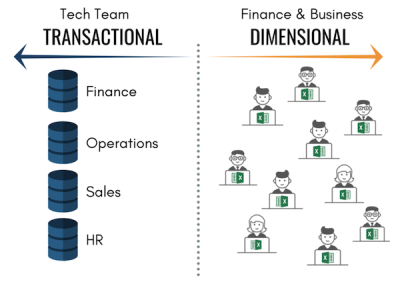
This fundamental difference defines how the data from these processes are managed. Essentially, backward looking data are captured as transactions in ERPs, supply chain systems, invoicing and accounting systems, etc., and data related to it is effectively stored in its databases. On the other hand, forward looking data (i.e., plan) typically reside in spreadsheets.
The financial planning process differs by company, which is the main reason users prefer Excel as the planning tool of choice. It provides the flexibility and customization they need. However, spreadsheets don’t work particularly well for team-based, collaborative efforts. They get large and unmanageable very quickly.
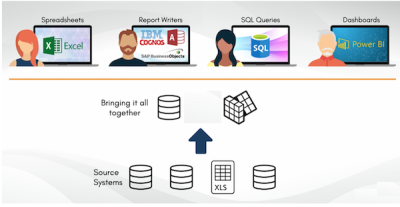
What does this mean for Business Intelligence (BI)? BI tools, especially user-facing ones such as data visualization tools, are great for representing historical data. Tools such as Tableau, Qlik, PowerBI, and others have robust features that allow direct connection to systems that contain transactional data and create stunning dashboards that effectively draw out insights from its users. However, due to the nature of planning, Excel is the de facto tool of choice because it is understood by 750 million users worldwide. Integrating Excel data with historical, relational data is often very challenging – hence organizations struggle to easily marry Excel with relational data for visualization purposes.
To have a complete vision of your business that enables users to make better informed decisions, it is necessary to marry the backward looking transactional data with the forward looking planning data. Tools exist in the marketplace to facilitate this that and make it easy for users to work through Excel as their primary end user tool of choice. The concept is known as Visionary Intelligence, that allows leaders to manage their businesses from both historical and forward looking perspectives.
What is Visionary Intelligence?
A guidance system that enables you to drive your business with information not just from the past (what traditional BI delivers), but also with your plans to direct a path towards the future you envision.
Integrating plans in BI dashboards and data visualizations can be challenging, but possible. Here are some of the main considerations organizations need to think about when doing so:
Dynamic Plans
As companies participate in the trend towards rolling plans they want to more easily drive team-based collaboration as well as more seamless integration of plan data into their visualization systems. Uploading Excel data over and over is simply too cumbersome. Rather than upload static data, a dynamic connection to the spreadsheets should be established.
For more information on the rolling forecast see, Be Agile and Responsive: Implement A Rolling Forecast
Collaboration in Excel
Let’s face it, business users love Excel, especially Finance professionals. They have become experts in spreadsheets, building complex financial models for their organizations and using their skills as an advantage throughout their careers. In order to establish a dynamic connection with a living spreadsheet, the system must also address the need for multiple plan collaborators to access and input plan data simultaneously.
There is more to collaboration than just co-authoring when it comes to planning. There may be several people involved in a financial planning process, and each one is responsible for a specific area of the business. These people have their own spreadsheets to work with which needs to be consolidated within a master spreadsheet. An effective system must provide access to a centralized spreadsheet multiple users can access through their familiar Excel interface. The data they input should be immediately reflected in their BI dashboards. Multi user and real time updates eliminate the need to have versions upon versions of the same spreadsheet.
Blending actuals with Plan
Preparing a dashboard process to accept planning data is half the challenge. For users to drive valuable insights, planning data needs to be analyzed together with actual data. Both must be “blended” to provide end-users a seamless way of showing actuals for closed periods and forecast for the remaining open periods. Having an easy process for displaying actuals side-by-side with various versions of the budget or forecast is also a key issue that many in the financial world face.
Already a Member? Login HERE.
Identify your path to CFO success by taking our CFO Readiness Assessmentᵀᴹ.
Become a Member today and get 30% off on-demand courses and tools!
For the most up to date and relevant accounting, finance, treasury and leadership headlines all in one place subscribe to The Balanced Digest.
Follow us on Linkedin!