Managing Margin, Risk, Financial Transparency in the Ethanol Industry
When it comes to margin and risk management, ethanol producers have difficult and unique choices.
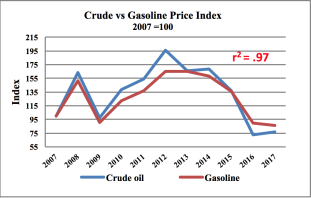
In most commodity processing industries, the output price is highly correlated to input price. For instance, in the energy sector there is a strong price relationship in the crack—the spread between crude oil and gasoline or diesel; in the metals sector there is a strong price relationship in the conversion—the spread between iron ore and steel; in the food sector there is a strong price relationship in the crush—the spread between soybeans and soymeal or oil.
The accompanying graph shows the crude oil and gasoline price index for the past 10 years, with its very high correlation coefficient of .97 r. An r of 1 indicates prices move exactly in step with one another, 0 indicates no correlation and -1 indicates they move exactly opposite of one another. High correlation is a major success factor when hedging strategies are used to protect margins in volatile markets. Over the past 10 years the crude oil annual average price change was 27 percent, with four years over 40 percent. Imagine the impact on the refining industry if the crack wasn’t highly correlated.
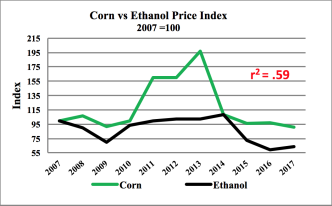
The ethanol industry is different. The main raw material, corn, originates from the ag complex while the main output, ethanol, is sold into the energy complex. This creates nightmares for risk managers in the ethanol industry. The accompanying graph shows the corn and ethanol price index (2007=100) for the past 10 years. The price correlation, r of .59, substantially lower than for crude and gasoline, increases the risk of profit margins fluctuating significantly over time.
To further complicate matters, an ethanol plant’s customers are using ethanol as a substitute or additive to gasoline. They use gasoline, not corn, as a benchmark to determine how much to pay for ethanol. Their margin structure is independent of the ethanol producers. On the origination side, the ethanol producer is in double jeopardy. First, the corn producer has an annual option to grow a better returning crop, potentially leaving ethanol producers short on corn. Second, corn producers have the option of selling their corn directly into the feed industry, creating a competitor for the ethanol producer whose economics are not tightly aligned with ethanol production.
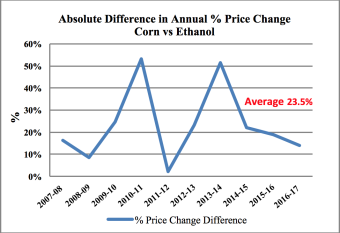
The absolute difference graph shows the annual percent price change between corn and ethanol over the past 10 years. Twice it was over 50 percent and in half the years it was over 20 percent, with an average of 23.5. The 10-year average simple gross margin (ethanol price less corn cost), shown in the accompanying graph, is less than the volatility between ethanol and corn prices. Welcome to the ethanol/corn margin roller coaster where, without strong risk management, one-year price swings can put you out of business.
With all of these extra factors, risk management in the ethanol industry requires the best-in-class people, systems and tools. The following roadmap will help management and boards of directors understand the risk, create an appropriate risk management system while developing the price risk tools and discipline to avoid the financial trauma that could occur from disjointed price moves in corn and ethanol.
Position Transparency
The initial step in managing price risk is to understand the exposure, which is dependent on the size of the position and magnitude of the price change. For example, if buying 100,000 bushels of corn at $3.50 per bushel and the price goes up to $4, the position can be sold for a gain. If the price goes down to $3, a loss would be incurred. Best-in-class position reports are built around the following:
• Contracts and trades are entered into the system in real or near real time.
• A contract and trade confirmation process ensures key terms (quantity, price, quality, location and shipment period) are agreed to.
• Position reports available in real or near real time.
• Position reports are built within the company’s accounting software.
• Time of shipment parameters are included to capture time spread risk.
• Priced (flat-price risk), unpriced (exposure to basis only) and hedging instruments are reported separately to highlight both flat price and basis risk by time of shipment.
• Net exposures are summarized.
Risk Management Policy
Developing a position report is only useful when the company has a clear vision on how it will merchandise the corn/ethanol crush in relation to its margins. A risk management policy involves setting limits on the potential financial exposure. For example, if the board set a $1 million price risk limit and used 50 cents per gallon as the per-unit risk multiplier, a 2 million-gallon position limit would be imposed.
Developing the position information in risk management is science. Creating the per-unit risk multiplier figure is art. It depends on a number of factors, including personnel skills to manage the activity, systems to execute and monitor the activity and the risk tolerance of the board. Many companies use a historical price range or the current volatility priced into option contracts to determine an acceptable per-unit risk multiplier. Best-in-class risk management is built around the following:
• A risk management policy approved by the board of directors.
• Hedging strategies to manage price risk developed and communicated to those engaged in trading, administering and monitoring.
• All products used to execute hedging strategies reviewed to ensure capabilities exist for trade execution and position management, administrative support for execution and monitoring and financial support.
• Position reporting methodology explained and approved.
• A mark to market methodology to determine exposure and monitor limits developed and approved.
• Position limits based on hedging products and approved strategies cover flat price, basis and time spreads.
Implementation
Effectively utilizing a risk management policy (RMP) requires highly skilled and disciplined professionals coupled with processes and systems that are effectively administered. Having a realistic understanding of the personnel capabilities and system functionality is important. An RMP that is simple (less hedging tools, fewer risk buckets) and can be administered is much more valuable than an RMP that is very sophisticated but beyond staff capabilities. Over engineering an RMP can cause a risk management system to implode. Best-in-class risk management systems include:
• Explicit training programs to trade, administer and monitor positions and prices for ethanol plant product inputs, outputs and hedge instruments.
• A formal risk management committee that includes executive management and board members.
• A contract and market price capture system for all significant plant product inputs, outputs and hedge instruments.
• A mark to market report that is real-time or daily, bringing all open commodity position to market, validating the price risk limit and identifying unusual market changes that may uncover risks not previously identified.
Link Buying, Selling
Risk management policies and systems are excellent for analyzing individual commodity risk and providing a measure of overall exposure, but they don’t identify timely margin structures. By overlaying current, historical and expected margins on top of the RMP, the raw materials origination and sales functions will become linked and focused on maximizing margins. Best-in-class margin management systems include a margin calculator for the corn/ethanol crush that includes all significant inputs, creates a crush margin curve by calculating deferred crush margins in addition to spot margins, uses current market prices and not historical costs. The system also includes a supply-chain diagram identifying volatile major inputs of suppliers, customers and intermediaries that is used to monitor the prices of their key inputs to determine potential impacts and create a plan should large price fluctuations occur.
A number of specific hedging strategies and actions can reduce commodity price risk in the supply chain and make financials more transparent. Supplier relationships and protocols help shift some price and volume risk either up or down the supply chain, including contracts that allow deferred pricing or flexible volume. With suppliers, terms can link purchase prices to ethanol, distillers or corn oil prices. Other strategies include:
• Match the pricing time frames and price by dates on purchase and sale contracts.
• Create real or near time links that connect sales quotes to raw material market prices—a major stepping stone to margin transparency.
• Use replacement cost to price your inventory, not historical values.
• Explore the use of third-party hedging tools such as forward contracts, futures, options, swaps.
• Match the pricing dates for corn and ethanol contracts.
• Implement inventory systems that forecast usage, track and report purchase commitments and physical balances.
• Develop an ethanol sales forecasting system to manage raw material needs. Include the storage and marketing of distillers grains.
• Increase purchasing leverage through buying consortiums or increased bank lines to take advantage of quantity purchases.
• Be creative in improving your suppliers or customers supply chain and take a share of the savings.
For ethanol producers, making the right choices is all about margin management, managing risk and creating financial transparency.
By Steve Rosvold for Ethanol Producer Magazine
March 21, 2017
Already a Member? Login HERE.
Identify your path to CFO success by taking our CFO Readiness Assessmentᵀᴹ.
Become a Member today and get 30% off on-demand courses and tools!
For the most up to date and relevant accounting, finance, treasury and leadership headlines all in one place subscribe to The Balanced Digest.
Follow us on Linkedin!