Visualization vs. Analytics Part I – Overview and Background
Overview
The difference between what we do and what we are capable of doing would suffice to solve most of the world’s problems – Mahatma Gandhi1
Data visualization and analytics tools are often confused by Finance, IT, and the business in that each sees these providing analytics. However, this is not the case. Data visualization does, well, visualization of data, and analytics does analytics calculations on data. The former displays the past and the latter predicts the future.
The difference between these tools is analogous to Microsoft Word vs. Excel. Word is for word- processing and Excel for calculations, yet how often do we do word processing in Excel . . . too often! This confusion runs with visualization and analytics tools, and it doesn’t help when visualization vendors extend their claims either.
Data visualization is about charting and dash- boarding, a most valuable capability to bring information to what has happened; i.e. hindsight information. Analytics uses mathematics, statistics and Artificial Intelligence (AI) to reveal unbiased insight about the current environment and predictions about what has a probability to happen. As such, visualization looks at the past, and analytics yields insights of the current and foresight about the future. These tools are valuable individually and symbiotically together. It’s not one or the other, or one before the other. Each has a value to bring in the business landscape.
This research paper defines the next generation Finance technology toolbox and how it is applied. It provides guidance on the fit of Data Visualization and Analytics tools in the stair-steps of the Evolution of Business Partnering, moving from a Finance Business Partner to an Analytics Business Partner.
We’ll clarify the differences between arithmetic vs. mathematics, dashboards vs. predictions, and charting vs. AI. The value of having both tool sets is to answer the five key questions to making data driven decisions for business growth and optimization of: What Happened, Where did it Happen, Why did it Happen, What Will Happen, and How To make it Happen?
Background
The role of Finance has evolved over the past 30 years with labels, such as, the Modern CFO, Next Generation Finance, and Agile Finance. With new titles come new requirements for Finance in the 2020s and beyond. Finance need adopt new people skillsets and software tools to master the new requirements.
In the 21st Century, Finance wants to be a partner who adds value to the business, and not just a scorekeeper reporting center. But how much value does Finance really add today?
Most Finance organizations still operate as a 1st Generation Partner. That is a supporting partner, using a strong financial backbone combined with some business acumen and collaborative habits. Fundamental, but does this earn Finance a seat-at-the-table? Not really, as Finance uses little more than financial data, and fewer use advanced analytics to generate insight and foresight to impact the strategic direction.
A 2nd Generation Partner, The Finance Business Partner uses financial information as a means to influence and challenge decisions. This generation becomes more exposed to commercial operations and serves the business units in an organization.
The next evolution comes with the introduction of the 3rd Generation Partner . . . the Analytics Business Partner (ABP). This concept is depicted in the Evolution of Business Partnering1 chart below, which defines the journey to the ABP through the incorporation of new technologies and broader skillsets.
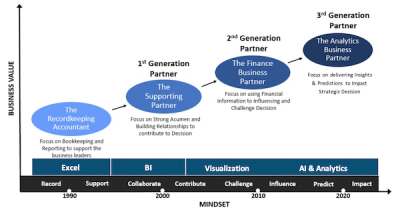
Mindset is focused on decision making. To support decisions Excel was the tool of the 90s, then BI in the late 90s to early 2000s to collaborate, followed by Visualization tools to challenge people’s “feelings” towards decisions. Today, we havethe rise of modern enterprise analytics tools applying advanced mathematics and AI for true quantitative unbiased insights that influence and impact strategic decisions.
Of the five key questions to making data driven decisions for business growth and optimization of What Happened, Where it Happened, Why it Happened, What Will Happen, and How To Make It Happen, data visualization does thefirst three and analytics the last three. Both tools overlap somewhat on Why it Happened.
Most Finance (and Operations) groups have not yet crawled from the primordial cloud of the 1st Generation Partner. Our research2 shows about two thirds of Finance is largely consumed in Excel and BI, with about 22% involved with visualization tools and moving to the 2nd Generation Partner. Less than 4% are using analytics, though over 60% are considering or planning analytics projects over the next few years.
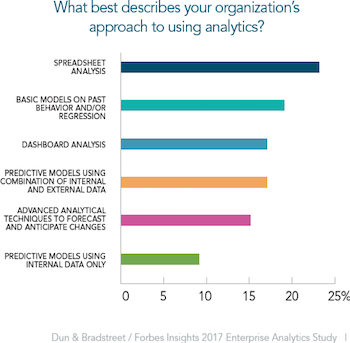
Further, look at the image to the right that asks the approach to “analytics”. Spreadsheets and dashboards are included, and as we shall see later, these tools are a misnomer to the definition of analytics.
The confusion throughout business of the term “analytics” incorrectly frames where companies are in their analytics journey and leads to misdirection of where they need to go.
Case and point to this misdirection is found by the Finance Analytics Institute Benchmark Survey3 that assesses the Finance toolbox, the Analytics Intelligence provided by Finance, and its Partnering capabilities. Of interest, is that many surveyed say they are already doing analytics yet have nothing more in their toolbox than Excel. What is merely variance analysis or data visualization is often confused as being analytics.
With this background, the pages that follow will assess and clarify the difference in tools and applications between data visualization and analytics.
Find Parts II and III to this series here:
Visualization vs. Analytics Part II – Visualization Tools
Visualization vs. Analytics Part III – Analytics Tools & Conclusion
Bibliography
Overview
1. https://www.brainyquote.com/topics/difference-quotes
Background
1. Robert J Zwerling & Jesper H Sorensen, October 2019, Analytics Business PartneringTM – The Evolution of Business Partnering
2. Finance Analytics Institute, Analytics Academy, September 2018
3. http://fainstitute.com/#benchmark
Already a Member? Login HERE.
Identify your path to CFO success by taking our CFO Readiness Assessmentᵀᴹ.
Become a Member today and get 30% off on-demand courses and tools!
For the most up to date and relevant accounting, finance, treasury and leadership headlines all in one place subscribe to The Balanced Digest.
Follow us on Linkedin!