Spotlight: Basics of cash flow management

Deployed vs Idle Capital
Analyses of private market performance tend to focus on how the General Partner (GP) generates returns—and understandably so. But while selecting top-tier managers and funds is paramount, the treatment of uncalled capital is also critical when evaluating the total return of a private market allocation, which is what truly matters to investors. A Limited Partner’s (LP’s) decision to commit to a fund often comes several years before that capital is ever transferred to the GP to be invested. This creates a challenge for LPs, who must balance the need to meet capital calls with the desire to maximize return.
Effective management of uninvested capital, primarily minimizing the amount of capital held in reserve while maximizing its return, can have a material impact on the ultimate performance of a private market allocation. Conversely, LPs need to formulate a strategy to efficiently redeploy capital as it is distributed back.
Warren Buffett and his vice chair at Berkshire Hathaway, Charlie Munger, thrust this rather arcane aspect of private markets into the spotlight in the first half of 2019 when they criticized the PE industry for not accounting for this potential drag from uninvested capital. “We have seen a number of proposals from private equity funds where the returns are really not calculated in a manner that I would regard as honest,” Buffett said. “It makes their return look better if you sit there for a long time in Treasury bills. It’s not as good as it looks.”
A thorough understanding of cash flow patterns will allow LPs to better plan for both capital calls and distributions, enabling them to enhance returns by keeping a smaller portion of their uncalled commitment in low-yielding liquid assets. But even the most sophisticated LPs, who can reliably predict their capital calls and distributions, will inevitably have to allocate some portion of uncalled capital to an asset with inferior returns to private market funds. The precise timing of contributions and distributions is impossible to know in advance, but historical data can offer helpful insight. In this series, we’ll explore various aspects of private market funds to help investors better understand how to manage a private market allocation and evaluate its true overall performance.
We’ll use cash flow data from PE funds to help answer some of these questions and highlight some of the main variables to consider when evaluating cash flows.
Key takeaways
- On average, PE funds call down about 5% of committed capital per quarter during the heart of the investment period, but the size of distributions can swing widely; half of all PE funds historically have made a capital call of at least 18.9% of the total commitment size at some point in the fund’s life, but a fund may also experience multiple consecutive quarters without capital being called.
- When trying to anticipate capital calls, fund age and dry powder prove to be the most reliable indicators. Capital calls taper off during a fund’s third year, which typically corresponds with dry powder falling to 25% of the fund size.
- Drawdown rates evolve throughout the market cycle, with PE funds calling capital more quickly during economic expansions. Furthermore, we observe a structural slowdown in the pace of capital deployment for more recent vintages.
Introduction
Investing in private funds is unique in that the investment decision isn’t accompanied by an immediate deployment of capital. In fact, when an LP commits to a fund, it now typically takes more than five years for a GP to call down all that capital. This creates a challenge for LPs, who must balance the need to meet capital calls with the desire to maximize return. Threading the needle between risk and return while maintaining adequate liquidity is a fundamental challenge of allocating to private market funds. The worst- case scenario is failing to make a capital call, which has serious repercussions, but a sin nearly as egregious for an LP is to simply let uncalled capital sit idly in a cash account. Most LPs are willing to go out a little further on the risk spectrum than a simple cash allocation, with many opting to park uncalled capital in Treasurys, but this still leaves much to be desired. Indeed, even incremental improvement to the management of uncalled capital can reap major returns for LPs, particularly those with large and mature portfolios.
The size of capital calls drops sharply during a fund’s third year
Average capital call as % of fund size by quarters since inception
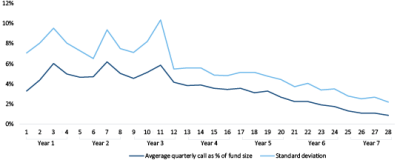
Source: Pitchbook | Geography: Global *As of December 31, 2018
It is unrealistic to think that an LP could ever perfectly time cash flows, but LPs can more effectively manage their portfolio by better understanding the mechanics of how funds tend to function. How often do capital calls tend to occur? What is the biggest capital call that can be expected? Does the business cycle have an impact on cash flows? Additionally, LPs need to consider how their unique circumstances affect portfolio management. What is the total expected return, and how will uncalled capital be managed accordingly? How much risk can and will be assumed?
Understanding cash flow patterns
Age and dry powder
On average, PE funds call down about 5% of committed capital each quarter through the heart of the investment period, which has continued to lengthen—as we will examine in the next section. Keep in mind this is only on average, and the size of capital calls can vary widely. While most tend to be relatively small, LPs need to be prepared to write larger checks because half of all PE funds historically have made a capital call of at least 18.9% of the total commitment size at some point in the fund’s life. Furthermore, one quarter of PE funds have made a capital call of at least 24.6% of the total commitment size. These large capital calls naturally tend to occur toward the initiation of the fund’s investment period, when the fund is most likely to be executing large platform deals. The standard deviation of capital calls is also significantly higher at the early part of the investment period, steadily declining as the fund ages.
A fund’s age is a straightforward way to gauge its maturity, but incorporating its dry powder into the equation provides a better way for investors to anticipate the magnitude of capital calls. As to be expected, funds with more dry powder tend to make larger capital calls. The average and median sizes of a capital call hover around 5% of the commitment size until 75% of the fund is invested, at which point the average tapers off. This is in part because funds simply have less capital to deploy, but PE funds also tend to transition their strategy during the investment period. Particularly in recent years, many GPs have emphasized add-on deals as a cornerstone of value creation strategies. These transactions naturally come later in the fund’s investment period and require smaller checks, as the businesses are intended to be bolted on to larger platforms.
Even though the size of capital calls begins to taper once 75% of a fund has been called, we find the frequency of capital calls stays relatively consistent. It is not until more than 90% of a fund is called that we see a precipitous drop in the frequency of capital calls.
Capital calls are largest and most frequent in a fund’s second and third year
Capital calls (#) as percentage of fund size by quarters since inception
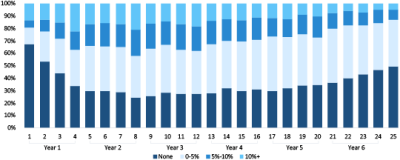
Source: Pitchbook | Geography: Global *As of December 31, 2018
Vintage and cyclicality
The prior charts and analyses have amalgamated PE funds across every vintage year; however, vintage year proves to be pivotal in determining the trajectory of cash flows for two reasons. The first is that drawdown rates of PE funds have fundamentally changed over the last two decades. Prior to 2000, on average, PE funds hit the 75% drawdown mark during their third year. More recently, however, it has taken nearly five years for funds to reach that mark, with the trend of slower drawdowns consistent throughout the stages of the investment period. We have certainly seen funds extending their investment periods in order to fully deploy their lot of capital, with most funds now calling capital well into their sixth year.
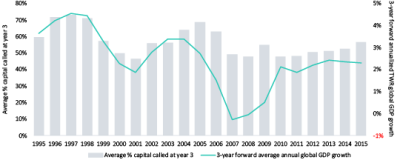
Bucketing funds by vintage year helps remove some of the noise and identify long-term trends, but assessing the drawdown patterns of individual vintages also proves interesting. In addition to long-term structural changes in drawdown rates, we found that the pace of PE investment ebbs and flows with the broader investment cycle. This cyclicality can be seen by taking a snapshot of how much capital different vintages had called at the three-year mark, juxtaposed with global GDP growth data from the subsequent three-year period to illustrate the prevailing market environment during the heart of the investment period.
Broadly speaking, PE funds deploy capital more quickly in positive economic environments, particularly in the run-ups to major downturns such as the dotcom bubble and global financial crisis. The inverse is also true, with funds that are active through the depths of recessions deploying capital more slowly. This aligns with broader trends in M&A markets and makes sense from an intuitive perspective. But it also seems to suggest that PE firms are prone to the same foibles as all investors, exuberant when prices are high but reluctant in tumultuous times when bargains are likely to be found. That said, the best GPs are likely to be those willing and able to invest through those turbulent times, as many of the top-performing funds historically have been those that were able to identify opportunities in the aftermath of downturns.
Size
Regardless of the strategy, it’s an investing truism that larger pools of capital are more difficult to deploy—and private markets are no exception. Fund size is negatively correlated with drawdown rates (i.e. larger funds call capital more slowly), particularly in the first two years of the investment period. The gap is particularly pronounced for the largest and smallest vehicles. On the smaller end of the spectrum, GPs often execute fewer deals per fund, which translates large checks relative to the fund size and more concentrated portfolios. They also tend to rely less on buy-and-build strategies, diminishing the need to maintain reserve capital.
The size of capital calls drops once funds are about 75% invested
Average capital call size as % of commitments by total capital called
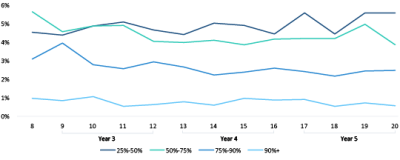
Source: Pitchbook | Geography: Global *As of December 31, 2018
Conversely, mega-funds are almost uniformly raised by massive GPs in perpetual fundraising mode. This means GPs often have dry powder remaining to be deployed in one fund when the successor has already been raised, which can be a drag on early capital deployment. Importantly, however, larger funds accelerate their pace of investment through the back half of the investment period, with total capital called converging with smaller vehicles midway in their fourth year.
Diversification
Understanding the general mechanics of private market funds can provide insight into how a fund’s cash flows are likely to materialize. But even in the best-case scenario, cash flow predictions for any individual fund are likely to conform only loosely to reality. An investor can remove some of the volatility in cash flows, however, by diversifying their private
The frequency of capital calls plummets after funds are 90% deployed
Percentage of funds with a capital call in the quarter by total capital called
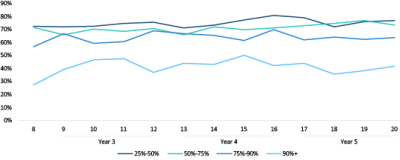
Source: Pitchbook | Geography: Global *As of December 31, 2018
Most funds now call capital well into their sixth year
Total capital called by vintage bucket by quarter since inception

Source: Pitchbook | Geography: Global *As of December 31, 2018
market exposure across a variety of funds. Just as adding more stocks to an equity portfolio dampens volatility, the addition of new fund commitments to a private market allocation results in smoother, more predictable cash flow patterns.
But diversification is inherently limited if investors restrict themselves to a single private market strategy. To that end, similar to how investors in public markets would be ill-served to allocate entirely to stocks, bonds or commodities, investors in the private markets benefit from expanding their purview beyond a single strategy, as we will explore in a future installment in the series.
It now takes about three years for a fund to be 50% called
Average PE capital called at 3-year mark by vintage
Source: Pitchbook | Geography: Global *As of December 31, 2018
.
.
.
.
.
Already a Member? Login HERE.
Identify your path to CFO success by taking our CFO Readiness Assessmentᵀᴹ.
Become a Member today and get 30% off on-demand courses and tools!
For the most up to date and relevant accounting, finance, treasury and leadership headlines all in one place subscribe to The Balanced Digest.
Follow us on Linkedin!