Simple Price, Gross Margin and Unit Variance Analysis
This Simple Price, Gross Margin and Unit Variance Analysis summarizes three key variables that drive earnings for most companies; Price, Gross Margin and Units Sold. The output, tables and graphs, will assist you in driving discussion around these key business drivers with your Executive Team.
This tool pinpoints which key drivers; price, units sold or gross margin are performing above, at or below budget. This information sets up the perfect framework for robust discussions on the root causes of variances and follow up action.
The simple entries you make are converted into variances based on units, currency and percentages. These variances are graphed to make them easy to grasp and share among a group.
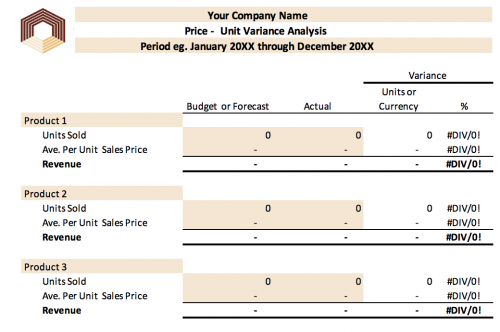
The Sales (Revenue) and Gross Margin matrix includes these variances for analysis:
Sales: Revenue Variance, % Revenue Variance, Unit Sales Price Variance, % Unit Sales Price Variance
Gross Margin: Gross Mgn Variance, % Gross Man Variance, Unit Gross Mgn Variance, % Unit Gross Mgn Variance
Both: Unit Variance, % Unit Variance
This analysis provides an excellent summary that can also be used for Board meetings.
Don’t miss the article that accompanies this tool! The Sweeping Change in Finance
Let us know how we can improve our tools to better serve you.
If you have any questions or stumble along the way, please reach out to us at CFO.University. You wouldn’t be here if you didn’t believe professional growth was critical to your success. We wouldn’t be here if we couldn’t help you accomplish that.