Too Many KPIs? Shortlisting: Why you need it and how it works
The problem Shortlisting solves
The single most common problem I’ve come across over the years isn’t coming up with KPIs, it’s coming up with a small selection of the right KPIs. The approach that most businesses instinctively take is either:
- A debate in a meeting. The group try to reach a consensus, often after lots of argument, about which are the most important things to measure. Potentially useful KPIs are often thrown overboard as they are ‘too hard’ and there are ‘already too many KPIs’. The shortlist is typically decided based on current ‘hot problems’ and ‘gut feel’. The selection is often contentious and may well be changed frequently after ‘agreement’.
- Not making a proper decision to cut the list of KPIs down at all. This results in huge load on the people producing the KPI reports and dashboards and mental overload for the poor souls who have to use them.
The good news is, there’s a simple, structured, approach we can use that takes the stress out of the shortlisting process. This approach is the Shortlisting KPIs step of the ROKS ExpressTM approach, Step 3.
Overview: How the Shortlisting steps work.
The idea behind shortlisting is pretty simple. It’s a four-step process, to make best use of our time. Start with the list of KPIs you have assembled.
1. First, we eliminate our weakest KPIs using the Sifting questions.
- Should we really try to improve that thing being measured?
- Can we improve it? Do we have the influence to improve it?
- Will we want to measure it in the future (perhaps when we have grown) but not now?
2. Then we rate each potential KPI on a scale of 1-10 based on two considerations:
- How important a KPI is in achieving our objectives?
- How easy it is to gather and calculate? We call this ‘Ease of measurement?’
3. Next we multiply these two scores together to give us the ‘priority score’.
4. Finally sort the KPIs by the ‘priority score’. A score of 100 is a ‘must have’ KPI. Work down the list in ‘priority score’ order, until we agree that we have the right selection of KPIs.
Introducing the Sifting questions
The sifting questions allow us to discard the weakest Longlist KPIs without debating them in depth.
Should we really try to improve that thing being measured? – Is it worth the time, effort and resources to improve it?
- Don’t care? - Then just eliminate it.
Can we improve it? Do we have the influence to improve it? – No? Just eliminate it, (unless having knowledge of it might affect your decision making.)
Will we want to measure it in the future (perhaps when we have grown) but not now?
- If it’s one for the future, eliminate it, but perhaps keep a separate note of it for future reference.
Why do we have Sifting questions and KPI scoring?
Depending on the level of debate, it can take 2-3 mins to score each longlisted KPI using the Importance/Ease of Measurement scoring approach. If you have 200 longlisted KPIs (not uncommon), we are looking at 6-10 hours of shortlisting - not much fun! This is when the Sifting questions come into play and can potentially save you hours of review time.
Scoring our KPIs for ‘Importance’ and ‘Ease of Measurement’
Scoring our Longlist
In this step we are going to score each of the longlisted KPIs for Importance and Ease of Measurement on a scale of 1-10. We will then multiply those scores together, for each KPI, to produce the KPI ‘priority score’. Sorting the longlist KPIs by KPI ‘priority score’ will then give us a way of identifying our priority KPIs. Crucially, this approach also gives us a great reason for NOT measuring some things. Deciding not to measure certain KPIs can be the hardest thing to do in practice and is the key to KPI success.
Here’s what we mean by ‘Importance’
The easiest way to quantify Importance is to ask ‘If this ‘thing’ is within our ‘sphere of control’ and goes out-of-control, what happens to the business?’.
Examples of ‘Importance’ scoring
Example of Importance score = 10
A 10 indicates a lack of control of this KPI may permanently and irreversibly destroy your business. Examples might include…
- If we are an online business and we get zero website hits, what happens? We don’t sell anything and go bust - that’s a 10 for Importance.
Examples of Importance score = 5
An importance score of 5 shows something that has significant impact on the business in the short-to-medium term but that impact is unlikely to profoundly change the future of the business in isolation. Put another way, these are things that, if neglected, would cause our business some harm but probably won’t sink us.
- Junk email complaints about marketing emails going through the roof.
- Itemised controllable costs running out of control (as opposed to total costs).
- High staff attrition - although serious, it’s visible without KPIs, so this might be a 5 in terms of KPI Importance.
Examples of Importance score = 1
There are a vast number of things you could count or measure that are trivial or are completely outside of your control, and so would score a 1 on the importance scale. These are all flawed or irrelevant measures that have little or no impact on meaningful strategic goals. Examples might include…
Lines of code written per day by a developer.
- Why a score of 1?: It’s an almost meaningless productivity measure for coding as volume of code has almost no positive relation to code performance.
Quality problems fixed
- Why a score of 1?: Is being busy fixing problems good, or better to have no problems in the first place?
Gross Domestic Product for country of operation.
- Why a score of 1?: If you are a small business this is vastly beyond your sphere of influence, so, although it may affect you, we give it a 1 for importance in this situation.
Typically, if a reported KPI makes no difference to the business decisions then you should give it a minimal score for Importance.
Here’s what we mean by ‘Ease of Measurement’
The ‘Ease of Measurement’ score should show how easy it is to collect, collate and calculate a KPI.
You should also consider if the work required to be able to collect a KPI is a ‘one off’ (e.g. Write a query for a database, installing a data logger etc.) or sustained (e.g. Manual data collection standing in a shop recording queue lengths on a regular basis). Generally, valuable KPIs with high ‘one off’ effort are good candidates to put on our ‘Aspire’ list - KPIs we want to implement in the future - as they don’t suck up too much resource once they have been implemented.
Examples of ‘Ease of Measurement’ Scoring
Examples of Ease of Measurement Score=10
- If we already had an automated display showing live data for ‘Average call queue time’ - that would be a 10 for ‘Ease of Measurement’.
- Our online banking app displays our current business cash balance at the touch of a button on our mobile phone.
- Sales for our shop today - automatically generated by our EPOS/till system..
Examples of Ease of Measurement Score=5
- Average market hourly pay rate. Some internet research and collation required, but nothing too challenging, followed by some light arithmetic.
- Queue time for [physical] queues of people - requires simple manual sampling and data collection, but may be automated (with some effort).
- Contact interaction audit score - requires manual scoring and collation.
Examples of Ease of Measurement score=1
- Percentage of shopper’s food budget spent in our store versus competitors.
- Measuring baby enjoyment of baby-gym business.
- Value of royalties infringed - a potentially unknowable figure.
Using the scores to plan your KPIs
If a particular KPI is both important and measurable, then it’s the one we should definitely think about measuring. Here’s a picture to sum this up…
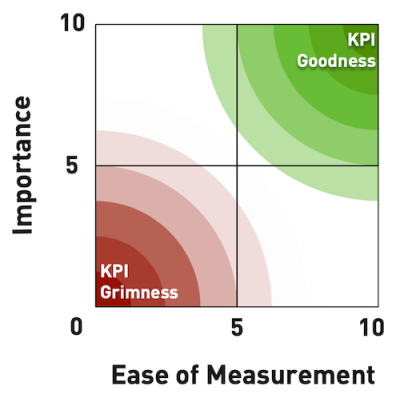
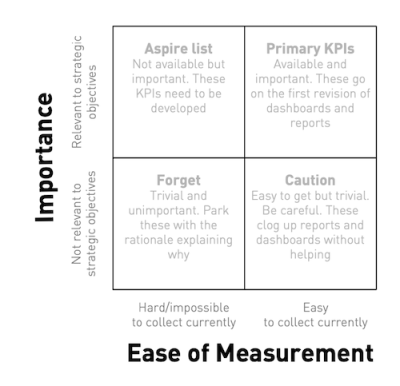
Once your KPIs have been scored, you can plot the scores on a grid like the one above. You could then divide those KPIs into four groups as shown below…
If you are using the Post-it method, you will have your KPIs plotted on a grid, and can just draw the box labels on the flip chart. You can also use our simple KPI Shortlisting Matrix template. To retrieve the template click here, KPI Shortlisting Matrix.
Add each of your KPIs to the corresponding point on the KPI Shortlisting Matrix that fits its relative Importance and Ease of Measurement.
Now we have divided our candidate KPIs into four buckets. Each bucket suggests a different set of actions for the KPIs within it. The recommended actions are…
Primary KPIs. The high-importance and easily available quadrant is the group of measures you are likely to put on your first dashboard/report. Easy to get hold of and important, these are strong candidates to be on the list of the first KPIs you set up. It’s quite a big range from 10-10 down to 6-6 score. So, if you have too many KPIs in the box, start at the top right hand corner first then work down towards the bottom left hand corner of the Primary KPIs bucket in your prioritisation.
Action:
- Mark all the ‘keepers’. Add a ‘Yes’ in the ‘Shortlisted’ column on the KPI Shortlisting Template. Mark rejections with a ‘No’ in the ‘Shortlisted’ column.
- Add a note on any rejected ‘Primary KPIs’ explaining why they were rejected. This will be useful if you are challenged later on.
Aspire list KPIs. The high-importance and difficult-to-collect quadrant. The Aspire list becomes the ‘to-do’ list for your dashboard. This is where you focus your KPI development effort. These KPIs may need some (maybe lots) of work to make them reasonable to measure. Don’t give up on them though. If you can measure something that others find hard to measure (importance of a web page, anyone?) then it can be a ‘gold bar’ for your business. Keep an eye on these and commit to moving one or two into the ‘Primary KPIs’ bucket in the future.
Action:
- Mark all the ‘keepers’. Add a ‘Yes’ in the ‘Shortlisted’ column on the KPI Shortlisting Template. Mark rejections with a ‘No’ in the ‘Shortlisted’ column.
- Add any future KPIs, that perhaps are valuable but need more work on ease of collection, to your ‘To-do list’ or mark the Shortlisted field next to those KPIs as ‘Future’.
- Add a note on any rejected ‘Aspire List KPIs’ explaining why they were rejected. This will be useful if you are challenged later on.
Caution KPIs. These are the trivial but easy to collect measures. It’s a high-risk group if you find it hard to leave stuff out or ignore things. These KPIs tend to be system generated (till systems, call handling software and so on). Hardware and software vendors often decide to offer everything including the ‘kitchen sink’ because it’s easy and they want to be seen as adding value. Don’t add these to your dashboard just because they are readily available. Being ‘interesting’ isn’t a good enough reason to add KPIs to your dashboard: you have to know that the KPI is linked to one of your objectives in a significant way. Double check any that border on an Importance score of 6, but don’t get sucked into putting something on the dashboard or report simply because you can.
Action:
• Mark all the ‘keepers’. Add a ‘Yes’ in the ‘Shortlisted?’ column on the KPI Shortlisting Template. Mark rejections with a ‘No’ in the ‘Shortlisted?’ column.
Forget KPIs. The trivial and yet hard-to-collect measures. Unless these are close to the centre of the quadrant boundaries, forget these and move on. For those close to the top right-hand box you may just want to double-check your assessment.
By the end of your session you should have divided your candidate measures into three lists:
- Do-it-straight-away list of measures - the Primary KPIs List.
- To-do list of measures to develop - the Aspire List (your ‘To-do list’ for your KPIs).
- Reasons for rejecting - your Forget List.
Tip: Why the Forget List is important
It is easy to overlook the last point, as you are not going to implement these measures, but that would be a mistake. Recording which measures you chose to reject with the reasons why can be a really powerful way of explaining the tough choices made. ‘We didn’t go with that measure and here are the reasons why…’ can be a powerful weapon in stopping report ‘bloat’.
Develop measures to fill the gaps - Your Aspire list measures
The measures that ended up in the Aspire List may just not be measured currently or they may be important, but tricky, to measure.
Although in some situations it may be easy to add the new measures into existing data collection systems, very often it isn’t that straightforward. I would recommend setting up each measure as a ‘mini project’. This gives you some framework and structure and stops you potentially sleepwalking into something nasty.
In practice it’s quite rare that we decide to measure all of the KPIs in the ‘Primary KPI’ box and ignore everything else. Sometimes there are too many KPIs in the Primary KPI box, other times we are still interested in the KPIs in the Aspire or Caution boxes.
How many KPIs should I have?
I’m afraid there is no simple answer to this question. If you have no measures currently then the answer is ‘At least one’. What I would strongly advise against is overloading yourself. Choosing too many KPIs initially means you run the risk of giving up part way through and feeling like you failed. If you aren’t sure, the best approach is to choose a very small number of KPIs (two or three) that you are in no doubt are super important to your business. Get started with those. Once you have started to develop the ‘KPI habit’, go back and run through your shortlist for additional KPIs.
Learn more from Bernie here:
Getting Started with KPIs’ by Bernie Smith available on Apple Books
Or in print from Amazon Getting Started with KPIs’ by Bernie Smith
Bernie’s full self-paced eLearning course KPI Bootcamp
Already a Member? Login HERE.
Identify your path to CFO success by taking our CFO Readiness Assessmentᵀᴹ.
Become a Member today and get 30% off on-demand courses and tools!
For the most up to date and relevant accounting, finance, treasury and leadership headlines all in one place subscribe to The Balanced Digest.
Follow us on Linkedin!