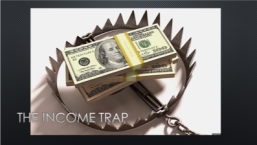
Do You Know What the Income Trap Is? You’d Better
Welcome to CFO.University’s transcript version of Joe Connors’, CFO Ed Talk “Do You Know What the Income Trap Is? You’d Better”. Joe’s entertaining and wise message reminds us “It’s not what you make it’s what you keep” and how building net assets is frequently more important than growing revenue.
Enjoy. Learn. Engage.
——————————————————————————————————————————
The Income Trap
How many of you believe if you could increase your income it would solve a lot of problems? My name is Joe Connors. I’m a middle-aged business banker and over the course of my career I’ve seen a number of business financials and personal financials. What I’m going to tell you is that focusing solely on income is a trap. I call it the Income Trap. I’m also going to tell you the same trap that applies to individuals also applies to businesses, no matter their size. And what I’m also going to do is show you a few examples of how focusing solely on your income could put your business at risk.
You may recall the old adage; “It’s not what you make it’s what you keep”. That applies as much to businesses as it does to individuals. Do not become a victim of the Income Trap. So, I said I’ve looked at a number of financials over the course of my career. How do companies or individuals avoid this Income Trap? Well, to cover this we need to actually pivot away from the income statement and look at the balance sheet and when I look at a balance sheet I try to figure out why is company A more successful than Company B? Why was Company A able to endure a recession or a reduction in demand or loss of a significant customer whereas Company B couldn’t endure that and maybe Company B failed? Well, what I’ve found is when you look at the balance sheet you get an understanding of why they were able to survive challenging times.
The Speedometer and the Fuel Gage
So, when I think of a balance sheet I tend to think of a fuel gauge. The balance sheet as a fuel gauge; that balance sheet contains the reserves that a company relies on to propel itself forward. When you think of reserves there are typically two categories; financial reserves and liquidity reserves. When you look at a balance sheet there’s a very common ratio called the debt to equity ratio. That will give you a sense for the financial reserves that a business has; essentially, total liabilities or total debt over total equity. When you look at liquidity, there’s actually a liquidity ratio and you can calculate it different ways but essentially the numerator is cash, marketable securities and perhaps even receivables in some cases and the denominator is total current liabilities. The higher the number is the better the liquidity ratio. The leverage ratio, the first one we covered, the lower the number the better.
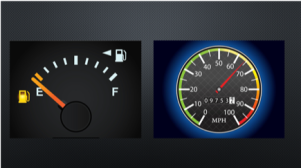
Let’s go back to the income statement and the income trap. When I think of an income statement I think of a speedometer, it tells management how fast are revenues growing, how fast are expenses growing, how fast are earnings growing? And when management looks at that speedometer, it has a sense for how fast the company is moving. But the really successful companies pay as much attention to their balance sheet as they do their income statement. They do not fall into the Income Trap. So if you can think of the income statement as your speedometer, imagine you’re cruising on Interstate 40 in a red convertible Ferrari. You’re doing one hundred miles per hour. What an exhilarating ride! Now you’re in the middle of the desert, had you not checked your fuel gauge before you left you may run out of fuel in the middle of the desert and have no way out. Not paying attention to your fuel gauge is akin to not paying attention to your balance sheet. How many of you have run out of gas? How many of you have worried about running out of gas? I can tell you a couple of years ago, on a summer road trip, my wife and I had driven up to Calgary, Canada to attend the Calgary Stampede. We’re working our way south and west back to British Columbia and eventually back to home in Portland, Oregon about a sixteen-hundred-mile trip. As we’re cruising along Interstate 5 in Canada, Canada Highway 5, we noticed that our fuel gauge was almost on empty, and we’re kind of looking at each other and saying oh my gosh! We were on a downgrade so my wife puts the vehicle in neutral and we coast. Shortly thereafter we see a sign and that sign says the next town that we were going to hit was called Hope. We kind of looked at each other and said “My gosh, I hope we make it to Hope!” Well, we did make it to Hope, but I can tell you hope is not a strategy that I embrace, and hope is not a strategy I recommend for you. Examples – Getting Caught in the Trap and Avoiding the Trap
Now I will come back to the Income Trap and talk about a couple of companies. Company 1, founded in 1985, is a high flying company. This company was focused on performance; the financial income statement performance. You can find quotes about this company where employees and associates have said, they felt that the only thing that mattered was profits. So this company did incredibly well. From 1999-2000, they grew their revenues from a little over forty billion to a little over one hundred billion, about one hundred fifty percent income growth over that two year period. When you looked at their balance sheet what you noticed was their leverage at the end of ‘99 was about two and a half to one. When you rolled it forward to the end of two thousand, it had nearly doubled to roughly four point seven to one. Actually, after the fact we know there were more liabilities and so the leverage would have been even higher. That company, in the third quarter of 2001 reported its first loss in four years. Two months later, in December, that company filed for bankruptcy. Company Number 1 was called Enron. Do you think Enron fell into the Income Trap? Now I’m going to talk about Company Number 2. Company Number 2 founded ten years later in1995, was a company that lost money for the first eight years of its existence. This company was growing revenues every year, it had losses, the losses were increasing but then they gradually began to diminish. That company in the fourth quarter of 2001 reported its first quarterly profit. That company did not fall into the Income Trap. In fact, they spent an awful lot of time understanding their balance sheet and their liquidity reserves. The trend that you see is that their liquidity or their liquidity ratio kept moving in the direction of one. They were generating as much cash as they needed to stay ahead of their current liabilities and meet their operating expenses. Company Number 2 is a company called Amazon. I don’t think I need to say any more about Amazon except that I would assert they did not fall into the Income Trap.
We’ve talked about a couple of companies. Now I will present two individual examples:
- We have this couple, a professional couple. They’re both working, gainfully employed and they meet with a financial planner. At the start of the meeting, the financial planner shares with them that at their ages and their income this is how much they should have saved for retirement. When that number is flashed on the screen, that number is essentially two times or double what they themselves have saved. The financial planner pauses and then he looks across the table and he says, “Are you OK?” The husband turns to his left, looks at his wife and notices that she is crying. That couple had fallen into the Income Trap. That couple was me and my wife.
- We’ve got two hypothetical folks, Jim and Bill. Jim makes one hundred thousand dollars a year, Jim drives a Lexus, he leases a new Lexus every three year, he lives in a high rent district he travels a lot for business so when he’s home he tends to eat out a lot. So even at one hundred thousand dollars a year Jim is not able, on an annual basis, to save any money for retirement. Now we look at Bill. Bill makes thirty-five thousand dollars a year. Bill oftentimes makes his own meals, brings his lunch to work and actually drives a Toyota Corolla. That Toyota Corolla is paid for. Bill does not live in a high rent district. Bill actually has been able to save about five thousand dollars a year. So, with a simple exercise when you look at Jim and you look at Bill, Bill over the course of forty years will have saved essentially a million three in retirement funding (you can do the math with using an eight percent compounded annual growth rate). It’s going to be a pretty significant number by the time he’s ready to retire. I would say Bill has not fallen victim to the Income Trap. Jim, on the other hand, forty years from now, will have nothing in retirement and he will have been solely focused on the income statement.
Falling into the Income Trap Increases the Cost of Capital
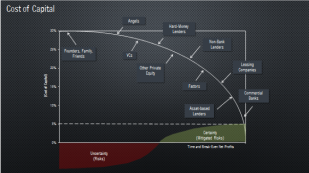
We’ve talked about Enron, we’ve talked about Amazon, we’ve talked about me and my wife. We’ve talked about Jim and Bill. What I want to do is pivot to the final point I want to make, “There is something else”. To illustrate this I often look at the Cost of Capital Curve. The Cost of Capital Curve is essentially a model that shows how a company moves along this curve. As it moves down the curve, it attracts a lower cost of capital. As it moves up higher on the curve, it’s a higher cost of capital. So generally, if a company has been a good steward of its financial reserves and its liquidity reserves, it’s going to be more effective at attracting a lower cost of capital and you know they say it takes money to make money? I’m actually going to explain to you how it can take less money to make more money. MFG Company approached me and several banks a number of years ago and they wanted to borrow a million dollars for a piece of equipment. Ultimately when you looked at MFG, they didn’t score very well in terms of their leverage. Their leverage was way too high and so many of the banks who might have offered that company five percent interest rate on that money weren’t able to help them. What did MFG do? It went to its equipment vendor and used a form of financing that would be akin to leasing, but the cost of that financing was fifteen percent. So on a million dollars (The actual price was two million. But let’s keep the math simple) that would be about one hundred fifty thousand dollars a year. Had they not been a victim of the Income Trap and spent as much time on the balance sheet, they would have been successful attracting five percent capital. Now think about that, the difference, one hundred fifty thousand versus fifty thousand. Had they not succumb to the Income Trap, that additional hundred thousand comes back into the company and allows the company to continue to improve its ratios and be able to attract that lowest cost of capital, so I would argue that MFG became a victim of the Income Trap.
Hope or Plan?

So, we’ve been on a journey, you’re all on a road trip and we’ve covered a number of things. It’s not what you make it’s what you keep. Pay attention to your balance sheet. Do not become a victim of the income statement. Understand your ratios, your leverage ratio and your liquidity ratio. You will save money and safeguard your business. You know, the acronym for balance sheet is B.S. Your balance sheet is not a bunch of B.S. You should pay attention to it. As you journey through life toward your destination, you’ve got a couple of options, you can hope, or you can plan, you get to choose.
Watch the CFO Ed Talk™or listen to the Podcast Here!
Identify your path to CFO success by taking our CFO Readiness Assessmentᵀᴹ.
Become a Member today and get 30% off on-demand courses and tools!
For the most up to date and relevant accounting, finance, treasury and leadership headlines all in one place subscribe to The Balanced Digest.
Follow us on Linkedin!